


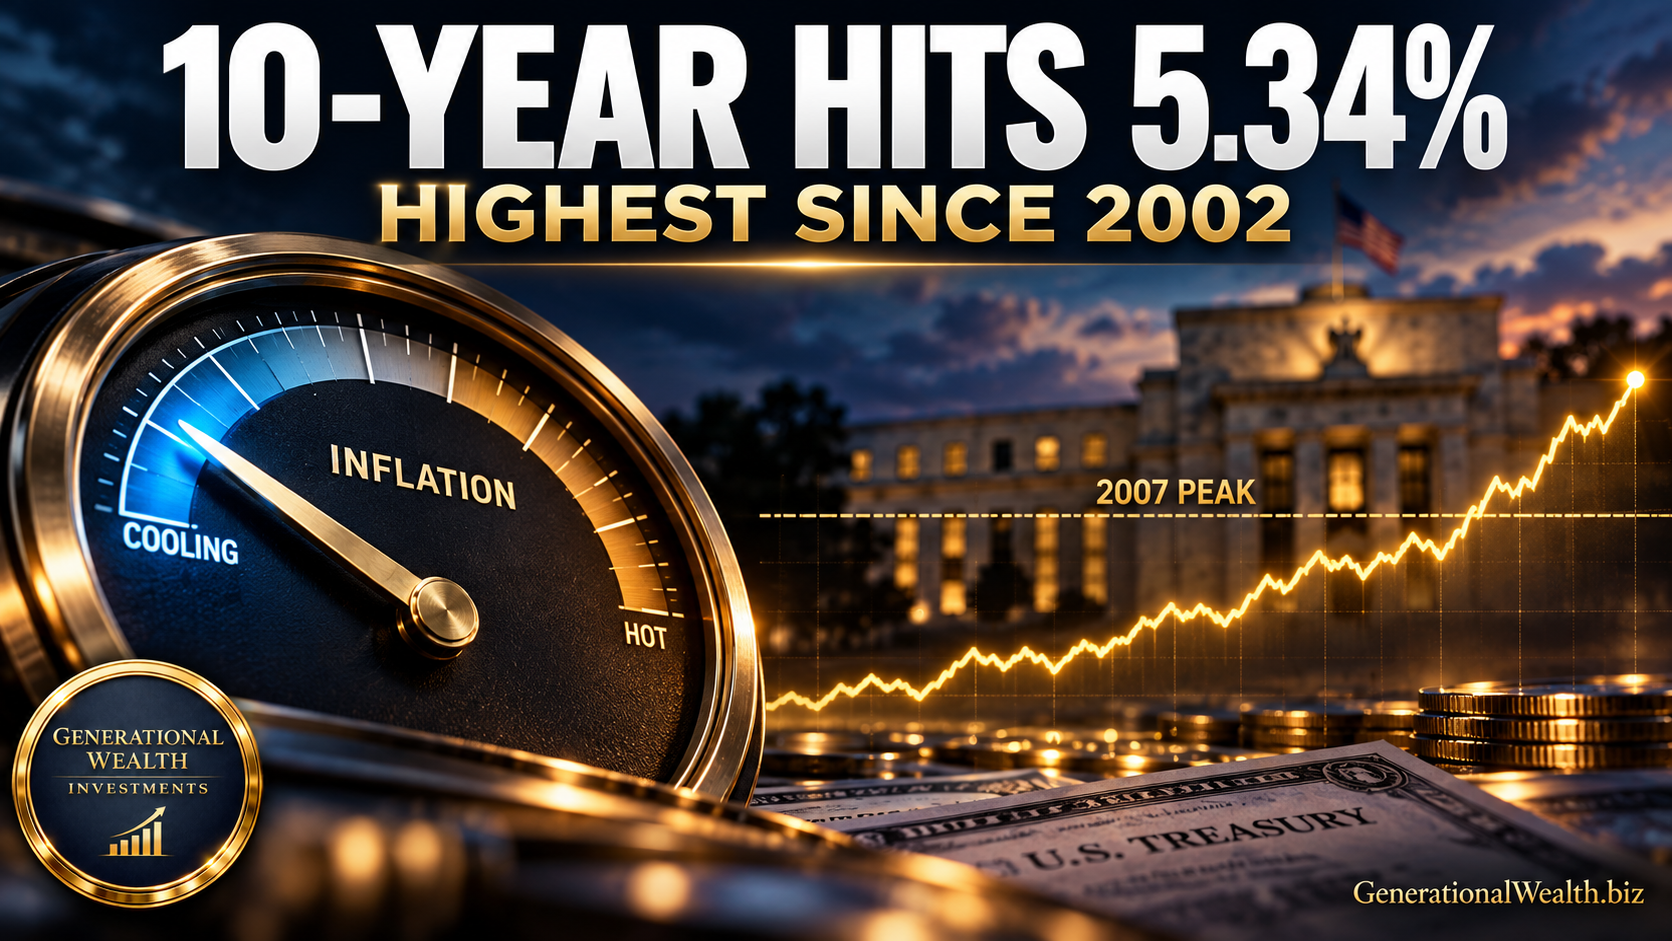
The 10-Year Treasury Yield Just Hit a 24-Year High — and a Softer Inflation Report Couldn't Stop It
The 10-year Treasury yield just broke its 2007 peak and hit its highest level in 24 years — the morning after inflation came in cooler than expected. When good news can't bring long-term rates down, the bond market is sending a message. Here's what's really driving yields, how it hits your mortgage and portfolio, and the 3 jobs-report scenarios that could decide what happens next.
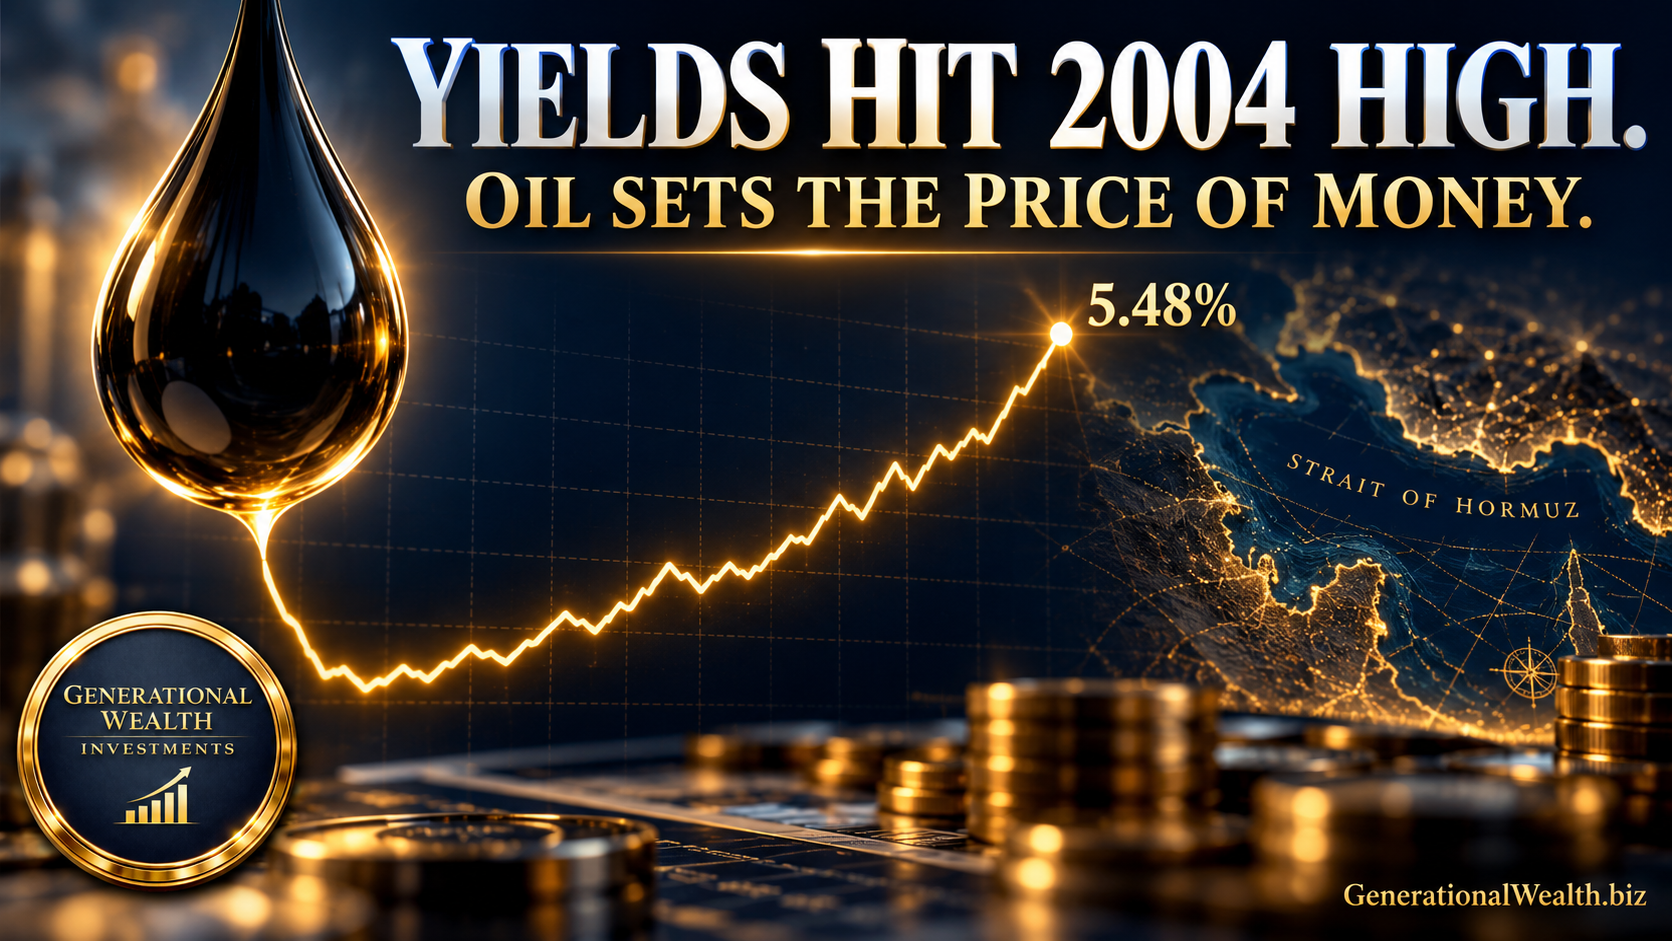
Oil Pushes the 30-Year Treasury Yield to Its Highest Level Since 2004
Oil just pushed the 30-year Treasury yield to its highest level since 2004. Then reports of U.S.-Iran talks on reopening the Strait of Hormuz knocked Brent $3 lower in minutes. Here's why the bond market is treating oil as an inflation problem, not a growth problem, and why next week's inflation data and jobs report could decide where yields go next.
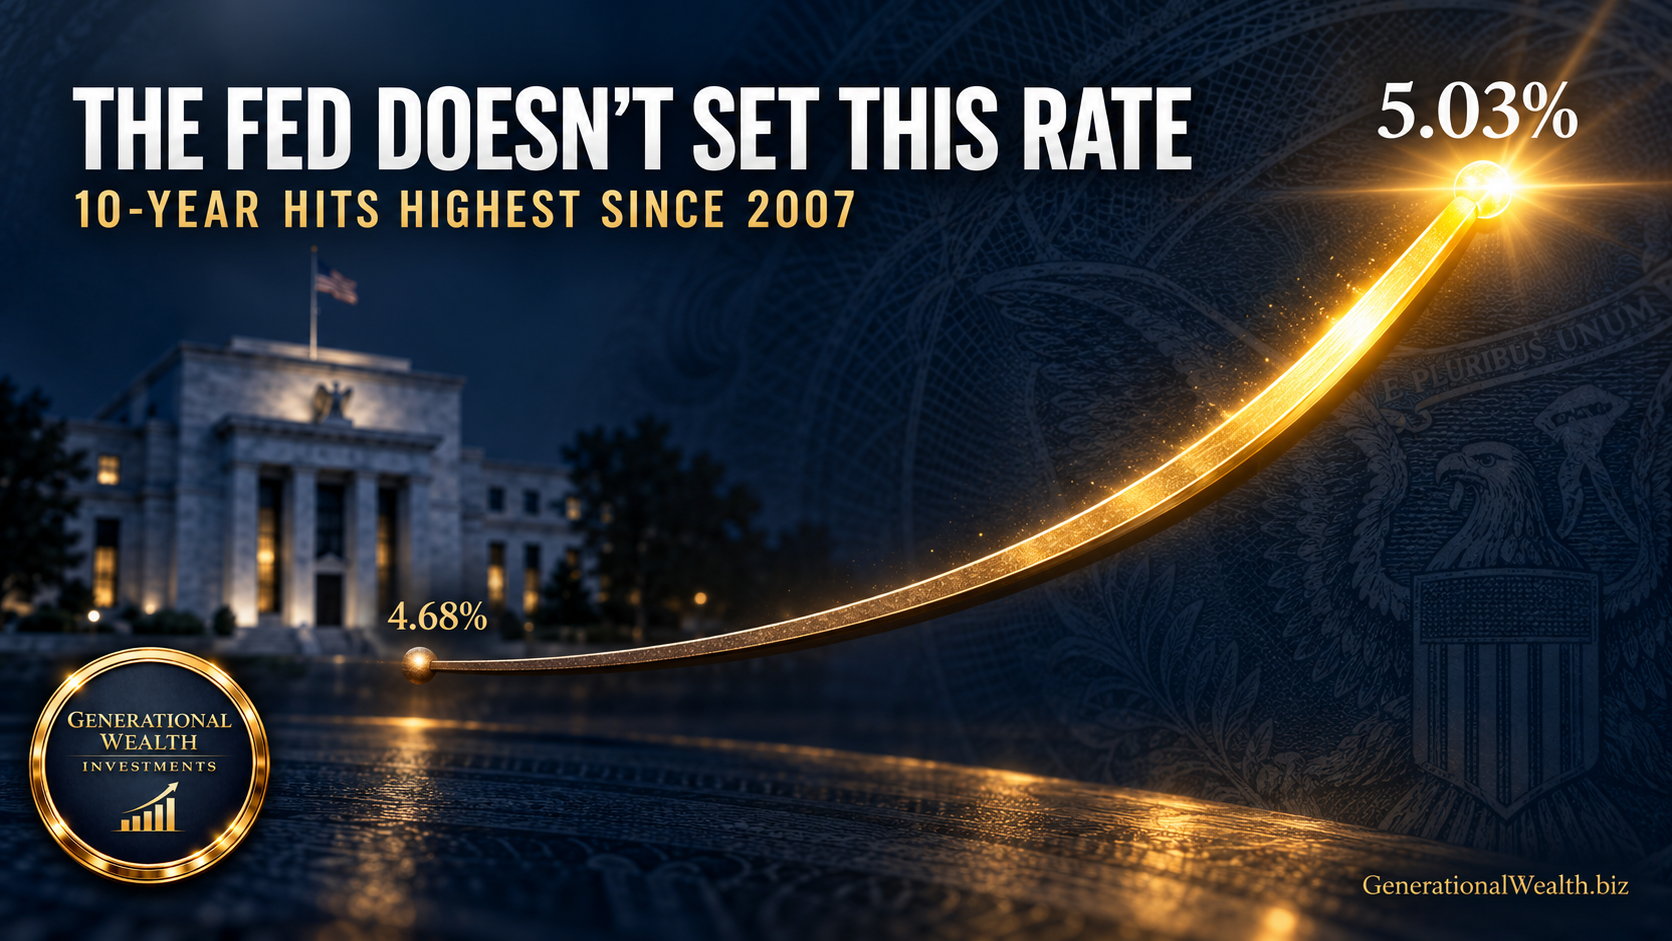
The 10-Year Just Hit 5.03% — And the Fed Doesn't Control That Number
The 10-year Treasury yield hit 5.03% overnight, its highest level since 2007 — and the 2-year barely moved. That gap is the whole story. Here's why an oil-driven inflation shock, not Fed policy, is repricing the long end of the curve, what it means for a 6.76% mortgage, and the 3 things in Wednesday's dot plot that decide whether this is one hike or the start of a cycle.

Meta Jumps 6.5% While the S&P 500 Falls: What Muse Actually Changed
On Wednesday the market sold the S&P 500 down 0.48% as oil broke $100 and yields hit multi-year highs — and bought Meta up more than 6.5%. That 7-point spread wasn't noise. Meta didn't beat the macro; it changed which side of it the company sits on. Muse attached a $20-per-month subscription to $130 billion in AI spending, and in a rising-rate tape, the market pays for what's close and sells what's far. The adoption test starts now.

Oil Broke $100 and Stocks Barely Blinked — Because the Bond Market Already Paid the Bill
Brent crude pushed past $100 a barrel Wednesday for the first time since July 24 — and S&P 500 futures barely moved. That gap isn't complacency. With the 10-year Treasury near 4.80% and futures pricing roughly 60% odds the Fed raises rates next week, the oil shock has already been absorbed through the rates channel instead of the equity channel. Thursday's PPI print is the sharper test of whether it leaks into everything else.

Oil Jumps 5%, Yields Hit a 3-Year High — and Gold Refused to Rally. That's the Real Story.
Brent settled at $94.65 and the 10-year Treasury yield reached 4.81% as renewed U.S.-Iran fighting near the Strait of Hormuz put a war premium back into crude. But gold made a 3-week low instead of rallying — and that single contradiction tells you more about this market than the oil headline does. Here's the transmission chain from a barrel of crude to your portfolio's discount rate, plus the four conditions that would break the thesis.

Oil Up, Yields Up, Gold Down: The Market Isn't Pricing Inflation — It's Pricing a Rate Hike
Rate-hike odds climbed to 66%, the 10-year Treasury yield hit its highest level since January 2025, and oil pushed near $92 on renewed Hormuz supply fears. But gold fell 1.2% — and that's the move worth decoding. When bullion drops into a rising oil tape, the market isn't pricing more inflation. It's pricing more Fed. Here's the mechanism behind the repricing, why a Strategic Petroleum Reserve at a 44-year low widens the risk, and the specific thing Friday's jobs report actually decides.

Brent Crude Falls 6% in 2 Sessions: Why the Hormuz Rally Is a Shipping Trade, Not a Fed Trade
Brent crude has fallen more than 6% in two sessions, Treasury yields dropped, and stocks closed green — but nothing about Fed policy changed. Every one of those moves traces back to a single waterway. Here's the mechanism connecting the Strait of Hormuz to the 10-year yield, the PCE trap waiting this morning, and the 4 data points that will confirm or break this rally.